More from Star Tribune
More from Star Tribune
More from Star Tribune
More from Star Tribune
More from Star Tribune
More from Star Tribune
More from Star Tribune
More From Star Tribune
More From Politics
Nation

Porn performer Stormy Daniels is called to the witness stand at Donald Trump's hush money trial
Prosecutors in the hush money trial of former President Donald Trump have called porn actor Stormy Daniels to the witness stand.
Nation
'Words matter:' Titles, Trump and what to call a former president
He's a criminal defendant, a businessman and a politician. But to his most loyal supporters, Donald Trump will always be Mr. President. As for the guy currently serving in the White House, they call him Biden, or maybe just Joe.
Nation
The Latest | New witnesses set to take the stand as Trump hush money trial enters its 13th day
As the third week of witness testimony in Donald Trump's hush money trial takes place, all eyes are on who will be called next and whether the former president will be able to abide by the terms of his now twice-broken gag order that bars him from speaking publicly about jurors, witnesses and some others connected to the case.
Politics

Minnesota Senate panel convenes ethics hearing into Sen. Mitchell's burglary arrest
Bipartisan subcommittee will also look into a year-old complaint against Sen. Glenn Gruenhagen.
Nation
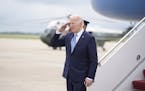
Biden to condemn current antisemitism in Holocaust remembrance amid college protests and Gaza war
President Joe Biden is set to issue a forceful condemnation of antisemitism during a Tuesday ceremony to remember victims of the Holocaust at a time when the Hamas attack on Israel and controversy over the war in Gaza have sparked new waves of violence and hateful rhetoric toward Jews.