Through seven innings in Wednesday afternoon's game against the Blue Jays, Joe Mauer was 2-for-3 with a walk. That's a .750 on-base percentage for the slumping Mauer, and if he could keep that up for the rest of the season he would be the MVP.
But most of us understand those numbers are what we call a "small sample size" -- a sometimes relevant set of data, but numbers that nonetheless can't be extrapolated to inform us of a trend.
In the larger context, Mauer is having a poor season. But his diminished output only represents about 5 percent of his career at-bats. Are these two-plus months of Mauer still a small sample size?
We asked the honest question on Twitter: when does a small sample size for a hitter magically become an adequate sample size? Because while most of us like to toss around the "small sample size" phrase these days, very few of us are actually well-versed in what it means.
Here is the ENTIRE SAMPLE SIZE of the responses to our second tweet:
The most consistent response to that and a previous tweet pointed us to Fangraphs, which has attempted to tackle this very question. A study suggests the following benchmarks "when certain statistics stabilize for individual hitters":
50 PA: Swing % 100 PA: Contact Rate 150 PA: Strikeout Rate, Line Drive Rate, Pitches/PA 200 PA: Walk Rate, Groundball Rate, GB/FB 250 PA: Flyball Rate 300 PA: Home Run Rate, HR/FB 500 PA: OBP, SLG, OPS, 1B Rate, Popup Rate 550 PA: ISOIn essence, the size of a relative sample is relative to what you're measuring. With someone like Josmil Pinto, with limited career at-bats, this is fairly cut and dried. With Mauer, though, it's still complicated. Do we choose to believe the greater sample -- more than 5,000 career plate appearances, which suggest Mauer is a very good hitter -- or the smaller but still relevant sample size from this season?
That's the crux of the Mauer debate.

In heated western Minn. GOP congressional primary, outsiders challenging incumbent

Minnesota Sports Hall of Fame: A class-by-class list of all members
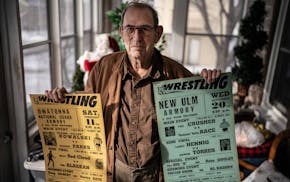
This retired journalist changed professional wrestling from Mankato