So, how good is this Twins team anyway? The traditional numbers say one thing. Sabermetrics might say another. Read on for a view through a different microscope. BY KEY POSITION PLAYER
Here's a look at 10 of the Twins' key position players, using their basic stats from 2010:
Denard Span: .264, 3 HR, 58 RBI *Tsuyoshi Nishioka: .346, 11 HR, 59 RBI
Joe Mauer: .327, 9 HR, 75 RBI
Justin Morneau: .345, 18 HR, 56 RBI
Delmon Young: .298, 21 HR, 112 RBI
Jason Kubel: .249, 21 HR, 92 RBI
Michael Cuddyer: .271, 14 HR, 81 RBI
Danny Valencia: .311, 7 HR, 40 RBI
Alexi Casilla: . 276, 1 HR, 20 RBI
Jim Thome: .283, 25 HR, 59 RBI
* Nishioka posted these numbers in Japan over a 144-game season for the Chiba Lotte Marines.
A CLOSER LOOK
Now, let's look at these players using some of the sabermetrics discussed on the previous page. But first, a few notes about these categories:
BABIP (Batting average on balls in play)
Source: fangraphs.com
• Last year, the average BABIP for a major league hitter was .297. Speed plays a role for hitters, who can leg out infield hits, but numbers significantly higher or lower than their career averages could suggest a correction is coming.
OPS+ (Adjusted on-base-plus-slugging percentage plus)
Source: baseball-reference.com
• This measures how a player's OPS stacks up over time when adjusted for league and ballpark averages. Target Field was tough on hitters, and this takes that into account. The average OPS+ for any league is 100.
UZR (Ultimate zone rating)
Source: fangraphs.com
• This measures the number of runs a player saves or costs his team on defense compared to an average player at his position. Some of these players played multiple positions, but these are their UZR values from their primary spot on the field. UZR is not calculated for catchers and doesn't apply to DH. The average UZR is 0.
WAR (Wins above replacement)
Source: fangraphs.com
• How many more wins did Joe Mauer give the Twins by keeping himself on the field, compared with a replacement-level catcher, such as former Twin Jose Morales? See below. The average major league starting position player has a WAR of about 2.0.
Span, CF: .294 BABIP, 85 OPS+, 6.3 UZR, 2.9 WAR
Nishioka, 2B: .389 BABIP, rest N/A
Mauer, C: .348 BABIP, 137 OPS+, , UZR N/A, 5.1 WAR
Morneau, 1B: .385 BABIP, 184 OPS+, 9.8 UZR, 5.3 WAR
Young, LF: .312 BABIP, 121 OPS+, -9.7 UZR, 2.1 WAR
Kubel, RF: .280 BABIP, 102 OPS+, -8.8 UZR, 0.3 WAR
Cuddyer, RF: .298 BABIP, 104 OPS+, -8.5 UZR, 0.4 WAR
Valencia, 3B: .345 BABIP, 116 OPS+, 5.9 UZR, 2.7 WAR
Casilla, SS: .304 BABIP, 97 OPS+, 4.0 UZR, 1.1 WAR
Thome, DH: .310 BABIP, 178 OPS+, UZR N/A, 3.6 WAR
Conclusions
• Span's career BABIP is .326, which suggests he went through some bad luck last season and could see his average rebound this year. The same goes for Kubel, whose career BABIP is .299. Morneau's career BABIP is .295, so the terrific success he was having before his concussion last year might have led to a second-half correction. It worked in reverse for Mauer, whose BABIP before the All-Star break last year was .315, compared with .391 after the break. Without knowing the average BABIP in the Japanese Pacific League, it's tough to say if Nishioka's batting title prowess is sustainable, but it's obvious he can leg out some hits with his speed.
• Morneau's OPS+ in his 2006 MVP season was 140 -- a figure that was 44 points below last season, which tells you what a special year he was having before suffering his concussion in July. Thome posted his highest OPS+ since 2002, when it was at 197 in a year he smashed 52 home runs and posted a .445 on-base percentage for the Indians.
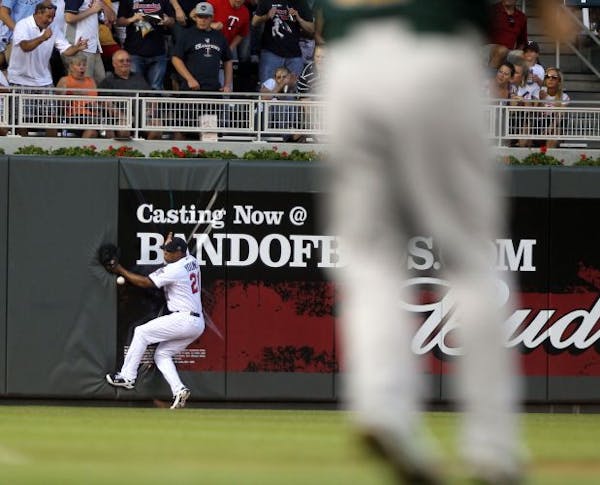
• UZR never has been kind to Young or Cuddyer, but Span fared well in his first year as the Twins' full-time center fielder. There was some concern after Span posted a -5.2 UZR as a center fielder in 2009, but that was in a limited sample size, over 84 games.
• If a player's UZR is low, his WAR suffers. Thome doesn't play defense, so he has no UZR, and his WAR reflects only his offensive value. For two years, Cuddyer has filled in admirably at first base after Morneau went down because of injury. Yet in 2009, when Cuddyer hit 32 home runs, his WAR was only 2.6. Last year, with his offensive numbers down and his negative UZR values, his WAR really took a beating.
BYPITCHER
Here's a look at nine of the Twins' key pitchers, using some basic stats:
Carl Pavano: 17-11, 3.75 ERA, 221 IP, 117 K, 37 BB
Francisco Liriano: 14-10, 3.62 ERA, 191 2/3 IP, 201 K, 58 BB
Nick Blackburn: 10-12, 5.42 ERA, 161 IP, 68 K, 40 BB
Brian Duensing: 10-3, 2.62 ERA, 130 2/3 IP, 78 K, 35 BB
Scott Baker: 12-9, 4.49 ERA, 170 1/3 IP, 148 K, 43 BB
Kevin Slowey: 13-6, 4.45 ERA, 155 2/3 IP, 116 K, 29 BB
*Joe Nathan:2-2, 2.10 ERA, 69 2/3 IP, 89 K, 22 BB
**Matt Capps: 5-3, 2.47 ERA, 73 IP, 59 K, 17 BB
Jose Mijares 1-1, .3.31 ERA, 32 2/3 IP, 28 K, 9 BB
* Nathan missed last season because of an elbow injury, so these are from 2009, when he converted 47 of 52 saves.
** Capps' totals include his time with Washington.
A CLOSER LOOK
Now, let's look at some sabermetrics, starting with a few notes on these categories:
BABIP (Batting average on balls in play)
Source: fangraphs.com
• A pitcher has even less control over his BABIP than a hitter. Once the ball leaves the pitcher's hand, much of the rest is out of his control. Last year, the average BABIP for a major league pitcher was .302, so extreme variances below could suggest a pending correction.
ERA+ (Adjusted earned-run average plus)
Source: baseball-reference.com
• Similar to OPS+, this is a pitcher's ERA adjusted for league and park averages, with 100 being average.
FIP (Fielding independent pitching)
Source: fangraphs.com
• This stat is designed to look like ERA, factoring in only the things a pitcher controls by himself: walks, strikeouts, hit batsmen, home runs.
WAR (Wins above replacement)
Source: fangraphs.com
• Twins righthander Jeff Manship, whose career WAR is 0.4, is an example of a replacement-level pitcher, the kind viewed to be readily available across baseball. This category tells you how many wins Liriano gave the Twins beyond what Manship could have provide with the same number of innings last year.
Pavano: .281 BABIP, 111 ERA+, 4.02 FIP, 3.2 WAR Liriano: .331 BABIP, 115 ERA+, 2.66 FIP, 6.0 WAR
Blackburn: .305 BABIP, 77 ERA+, 5.07 FIP, 0.4 WAR
Duensing: .272 BABIP, 159 ERA+, 3.85 FIP, 1.7 WAR
Baker: .323 BABIP, 92 ERA+, 3.96 FIP, 2.5 WAR
Slowey: .307 BABIP, 93 ERA+, 3.98 FIP, 2.2 WAR
*Nathan: .232 BABIP, 210 ERA+, 2.88 FIP, 1.9 WAR
**Capps: .309 BABIP, 167 ERA+, 3.23 FIP, 1.2 WAR
Mijares: .309 BABIP, 127 ERA+, 3.87 FIP, 0.2 WAR
* From Nathan's 2009 season.
** Combining Capps' totals with the Twins and Nationals.
CONCLUSIONS
• Liriano wasn't the only Twins pitcher who caught some bad luck last year. Baker's career BABIP is .303, and his 2010 total was 20 points higher. Meanwhile, Duensing's low BABIP is a reminder that his success last year involved some good fortune.
• Considering how well Pavano and Liriano pitched last year, their relatively modest ERA+ numbers reflect the benefits they had working at pitcher-friendly Target Field. For Liriano, references often are drawn to his rookie season in 2006, but there really is no comparison. That year, his ERA+ was 206.
• Even though Baker and Slowey struggled last season, their strikeout, walk and home run rates were very similar to their career averages. Their FIP numbers should remind people about their potential moving forward.
• Even though Liriano was more dominant in 2006, his WAR that year was 4.1. This is a counting statistic that builds over time, and he missed the end of 2006 because of an elbow injury. Keeping Liriano healthy is a big key for the 2011 Twins, and if they can get him to top 200 innings, he'll be even more valuable.
THE BOTTOM LINE
OVERALL: Mixed trends
These numbers suggest Liriano, Baker, Span and Kubel could trend upward in 2011, while Morneau, Valencia and Duensing trend downward.
At age 40, Thome is bound to show some decline. Nishioka remains a big unknown offensively, but based on the fielding skills he showed -- his exceptional quickness and soft hands -- he probably will have a strong UZR. Nishioka is replacing second baseman Orlando Hudson, who posted an above-average 3.1 WAR last season, largely because of his defense. If that turns into a wash, and Casilla does a decent job replacing shortstop J.J. Hardy (2.1 WAR last season), the Twins should have a good lineup, especially with a healthy Morneau.
PITCHING: Capable staff
The Twins return six starters who won 10 games last year. Even if you believe a pitcher's win total is meaningless, this tells you the Twins have capable starters, and top prospect Kyle Gibson is waiting at Class AAA. The bullpen has questions, but relievers don't pitch enough innings to make a huge difference in WAR. The three best righthanded relievers the Twins lost -- Matt Guerrier, Jesse Crain and Jon Rauch -- combined to post a 2.1 WAR last year, which doesn't sound hard to replace.
Add it up, and the Twins still look like a very competitive team. Can they win 94 games like last year? So much depends on health, but nothing in these numbers suggests that's an impossible goal.
![Minnesota Twins pitcher Jhoan Duran (59) in the ninth inning Tuesday, August 15, 2023, Target Field in Minneapolis, Minn. ] CARLOS GONZALEZ • carlos](https://arc.stimg.co/startribunemedia/NWLT5CNXGTRZA6KVTMIPSOG3KI.jpg?h=91&w=145&fit=crop&bg=999&crop=faces)
Twins closer Duran could begin rehab assignment next week
Verstappen wins again. This time he takes first Formula 1 sprint race of the season
William Contreras drives in 2 runs for Brewers in a 2-1 win over Cardinals in 10 innings
Ingram, Valanciunas lift Zion-less Pelicans past Kings and into the playoffs