News Graphics
News Graphics
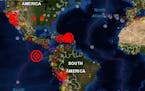
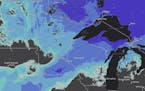
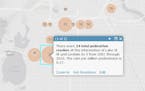
Earthquake mapper
Map of recent quakes that are occurring in both the United States and around the world. The data is from the United States Geological Survey's (USGS). Earthquake information is extracted from a merged catalog of earthquakes located by the USGS and contributing networks. Earthquake data will be available within a few minutes for California events, and within 30-minutes for worldwide events.
News Graphics
News Graphics
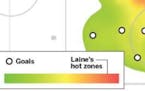
Left circle Laine
Heat maps of Patrik Laine's shot attempts this season show he's dangerous from the center of the ice all the time, and especially dangerous from the left circle when the Jets are on a power play.
News Graphics
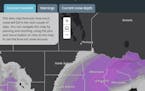
Snow forecast and weather warnings map
This web map forecasts how much snow will fall in the next couple of days. Navigate to the second map for current weather warnings from the National Weather Services.
You can navigate this map by panning and zooming, using the plus and minus button or click on the map to see the forecast snow amount or click on a warning area to get in-depth information for each site then click on MORE INFO to open a link to the latest NWS alerts and data.
News Graphics
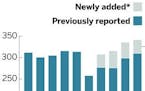
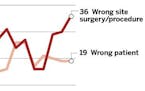
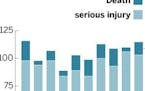
Hospital error events increase
Harmful "adverse events" in surgery and patient care continue to occur in Minnesota hospitals and surgery centers, despite more than a decade of efforts to publicly report and prevent them.
News Graphics
News Graphics
News Graphics
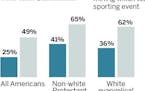
Americans belief in God and football
Almost half of Americans polled believe that God has a hand in the outcome of sports.
News Graphics
Snow depth analysis
The latest analysis of current snow depth from the National Weather Service: National Operational Hydrologic Remote Sensing Center
News Graphics
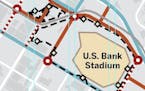
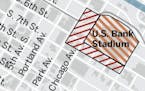
Super Bowl Live activities
The Minnesota Super Bowl Host Committee released the map for the 10-day free festival on Nicollet Mall beginning Jan. 26 and running through Feb. 4.
News Graphics
Minneapolis proposes more areas for billboards
A zoning amendment would expand the areas where billboards and signs are allowed in downtown Minneapolis.
News Graphics
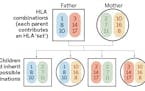
Bone marrow transplant compatibility
Protein markers called HLA (Human Leukocyte Antigens) that are inherited need to be similar so donors' stem cells don't attack recipients' bodies after transplant. Siblings only have a one in four chance of matching. Here's how it works.
News Graphics
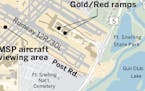
747 landing viewing areas
Some suggested spots to get a look at the last landing of a 747 at Minneapolis-St. Paul International Airport on Wednesday.
News Graphics
News Graphics
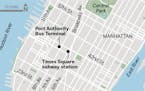
NYC subway bomb
A crude pipe bomb strapped to a man inspired by the Islamic State group went off Monday in a crowded subway corridor near Times Square.
News Graphics
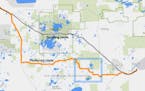
I-694 detour route
A washout on I-694 in Oakdale is forcing officials to close the interstate in both directions until further notice.
News Graphics
Dangerous intersections for pedestrians
The overwhelming majority of motor vehicle crashes in Minneapolis involving pedestrians happen on 10 percent of city streets — with West Lake Street proving to be the most perilous.
News Graphics
Enbridge Line 3 project
Enbridge Energy proposes to build a 340-mile crude oil pipeline through wild rice country in Minnesota to replace an older pipeline called Line 3. It is part of a $8.2 billion pipeline project from Hardisty, Alberta, to Superior, Wis. The Minnesota portion is estimated to cost over $2 billion. Lakes colored blue are recognized as wild rice lakes by the Minnesota Department of Natural Resources.
News Graphics
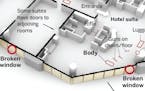
A look at the Mandalay Hotel suite
Diagram of the suite where the shooter opened fire from the 32nd floor of the Mandalay Resort Hotel and Casino.
News Graphics
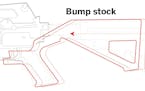
'Bump stocks' mimic machine guns
Replacement stocks called 'bump stock' allow an AR- or AK-style rifle to fire at a rate of up to 800 rounds a minute. The gunman at the Las Vegas massacre is reported to have used the 'bump stock.'
The Latest
-
4:08 AM
-
Yesterday
-
Yesterday
-
Yesterday
-
Yesterday
-
Yesterday
-
Yesterday
-
Yesterday
-
Yesterday
-
Yesterday
-
Yesterday
-
Yesterday
-
Yesterday
-
Yesterday
-
Yesterday
-
Yesterday
-
Yesterday
-
Yesterday
-
Yesterday
-
Yesterday
Most Read
Follow Us On
Most Emailed
Latest Minnesota news, weather, and sports.
Your trusted source for Minnesota news today. Read articles, view photos, or watch videos about news in Minneapolis, St. Paul, Twin Cities Metro areas, St. Cloud, Rochester, and beyond. The Star Tribune is committed to provide more of what matters to Minnesotans. All day. Every day.
