The Star Tribune and Minnesota Public Radio News polled 800 Minnesota likely voters between Sept. 10 and Sept. 12, on a number of topics, including whether President Trump should be impeached, and how they view their vote in the upcoming midterm elections. Highlights from those questions are below. Scroll down the page to see details about how the poll was conducted and the demographics of the 800 respondents.
Do you believe President Trump should or should not be impeached and removed from office?
Should Should not Not sure 36% 49% 15% Should Should not Not sure Men 31% 54% 15% Women 40 45 15 Democrats 67 14 19 Republicans 4 94 2 Independents / other 29 47 24 18-34 48 34 18 35-49 31 48 21 50-64 33 58 9 65+ 34 51 15 Under $50,000 37 50 13 $50,000 and over 34 52 14 Hennepin / Ramsey 42 41 17 Metro Suburbs 31 55 14 Southern Minn. 33 48 19 Northern Minn. 33 56 11 Trump voters 5 91 4 Clinton voters 66 12 22 Which of the following three statements comes closest to your view?
- I want my vote in November to support the direction President Trump is leading the nation.
- I want my vote in November to change the direction President Trump is leading the nation.
- My vote this November doesn't have much to do with President Trump and his policies.
Support Change Nothing to do Not sure 29% 43% 27% 1% Support Change Nothing to do Not sure Men 32% 39% 28% 1% Women 26 47 26 1 Democrats 1 83 15 1 Republicans 74 1 24 1 Independents / other 18 38 43 1 18-34 15 61 24 0 35-49 28 44 28 0 50-64 33 37 29 1 65+ 34 38 27 1 Under $50,000 33 40 26 1 $50,000 and over 29 42 28 1 Hennepin / Ramsey 21 52 25 2 Metro Suburbs 33 39 28 0 Southern Minn. 31 42 27 0 Northern Minn. 34 37 28 1 Trump voters 66 2 31 1 Clinton voters 1 83 15 1 About the poll
This Star Tribune/MPR News Minnesota Poll findings are based on interviews conducted Sept. 10-12 with 800 Minnesota likely voters. The interviews were conducted via land line (60 percent) and cellphone (40 percent). The poll was conducted for the Star Tribune and Minnesota Public Radio News by Mason-Dixon Polling and Research Inc. Results of a poll based on 800 interviews will vary by no more than 3.5 percentage points, plus or minus, from the overall population 95 times out of 100. Margins are larger for groups within the sample, such as Democrats and Republicans, and age groups.
The self-identified party affiliation of the respondents is 37 percent Democrats, 31 percent Republicans and 32 percent independents or other.
Sampling error does not take into account other sources of variation inherent in public opinion surveys, such as nonresponse, question wording or context effects. In addition, news events may have affected opinions during the period the poll was taken.
Readers can e-mail questions to djmcgrath@startribune.com.
Demographic breakdown of this polling sample
PARTY DFL/Democrat 299 (37%) Republican 246 (31%) Independent/Other 255 (32%) AGE 18-34 152 (19%) 35-49 200 (25%) 50-64 226 (28%) 65+ 216 (27%) Refused 6 (1%) GENDER Male 377 (47%) Female 423 (53%) INCOME < $25,000 84 (10%) $25,000-$49,999 127 (16%) $50,000-$74,999 130 (16%) $75,000-$99,999 121 (15%) $100,000+ 125 (16%) Refused 213 (27%) REGION Hennepin/Ramsey 255 (32%) Metro Suburbs 230 (29%) Southern Minnesota 160 (20%) Northern Minnesota 155 (19%) INTERVIEW Land-line 483 (60%) Cell Phone 317 (40%)
Biden administration moves to make conservation an equal to industry on US lands
Coalition to submit 900,000 signatures to put tough-on-crime initiative on California ballot
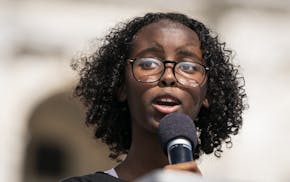
Rep. Omar's daughter arrested, suspended from college for pro-Palestinian protests
First major attempts to regulate AI face headwinds from all sides